
Chapter 6    Empirical Model Identification

Home    Index

Check Your Reading             Study Questions             Thought Questions

The questions will be categorized according to the three key concepts in this chapter.

Experimental Method Process Reaction Curve Statistical Method


Check Your Reading

Solidify the Concepts

6.1
Why do practicing engineers often use empirical models and not always develop fundamental models?


They didn't pay attention in their process modelling course.


To obtain a model that is accurate over a wide range of conditions.


Fundamental models can require lots of time and data.


Performing experiments in operating chemical plants is so easy.


6.2
To apply the process reaction curve (graphical) method, the
process response must be...

Process Reaction Curve


be exactly first order.


be exactly first order with dead time.


have a positive gain.

 
have an overdamped, monotonic step response.


6.3
What is the major
deficiency in process reaction curve Method I?

Process Reaction Curve


Evaluating D. (capital delta)


Evaluating d. (lower case delta)


Evaluating q. (theta)


Evaluating S.


6.4
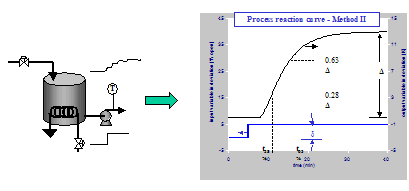
What was the basis for selecting the
times to be at 28% and 63% of the total change in Method II?

Experimental Method


Only those two times can be used.


One point was enough, extra points improves accuracy.


Two points (equations) are required to determine two parameters  (q + t). (theta plus tau)


These times improve the signal-to-noise ratio because they are far apart in time and the output variable is changing rapidly.


6.5
How can we determine how close to
linear a process behaves?

Experimental Method


In a strictly linear system, the parameters do not change with operating conditions.

(Kp = gain, t = time constant, and q = dead time)


perform one process reaction curve experiment.


Perform several process reaction curve experiments with the same d and compare values of Kp, q and t.


Perform several process reaction curve experiments with different magnitudes and signs of d and compare values of Kp, q and t.


Perform one experiment and evaluate the parameters using the statistical approach.


6.6
When we determine a model using the
statistical method, the parameters a and b are estimated by minimizing the sum of the squares between the data and model.   What key result simplifies the solution?

Statistical Method

Looks more complicated, but calculations can be done in spreadsheet.


The calculations can be performed by hand.


The parameters are determined without error.


The resulting equations are linear.

 
Only a few data points are needed.